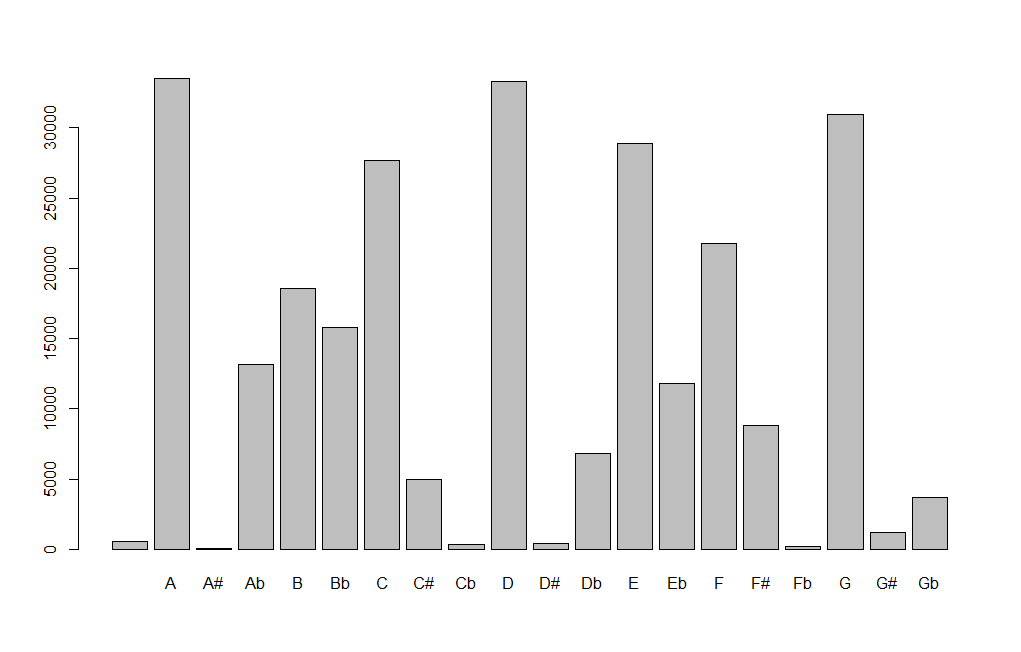
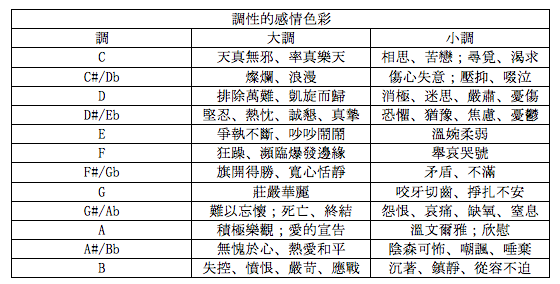
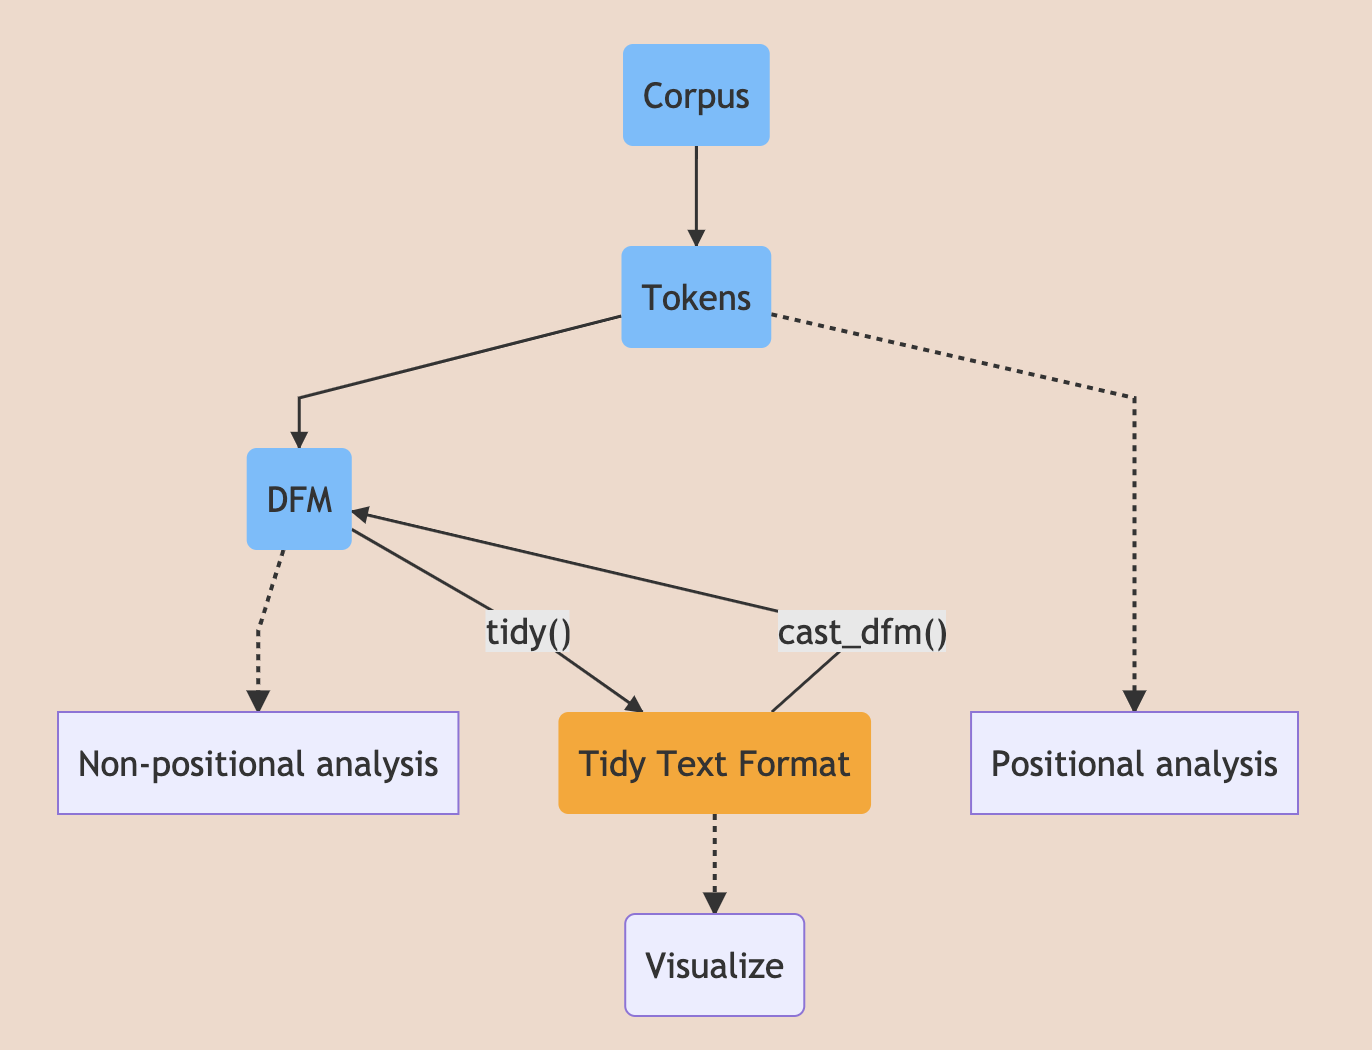
background-image: url(https://encrypted-tbn0.gstatic.com/images?q=tbn:ANd9GcTdVuzJDXghejKmKbnlhzqE2SEez7J57fpQHXqE0FWIt_KS5FiJuw&s) background-position: center background-size: cover class: title-slide .bg-text[ # Introduction to Data Science with R ### week.13 <hr /> 12月 5, 2019 謝舒凱 ] --- # R 還可以做很多事 - 例如祝別人生日快樂 `birthday.R` --- # R and Computational Music Analysis Frequency of chord roots in **McGill Billboard dataset**  --- ## Text and/to Melody  E.g, why is [AI.Text2Melody](https://melobytes.com/en/app/melobytes) still hard? --- ## 回顧(初級)文本分析基本流程圖示 <img style='border: 1px solid;' width=90% src='./images/tm001.jpg'></img> [source](https://manoharswamynathan.files.wordpress.com/2015/04/r-text-mining-001.jpg) --- ## Text analytics / Text mining flow 目前前兩項應該大家都有概念了。 .large[ - **Preparing / Preprocessing / Representing textual data**. ] - 蒐集與前處理 collecting raw text and preprocessing, - 文本表徵 representing text using e.g. Term Frequency-Inverse Document Frequency (TFIDF) to compute the usefulness of each word in the texts, - 字詞(語意)向量 word vectors (distributional and distributed semantics) .large[ - **Exploratory data analysis and Infographics** ] - data visualization for the purpose of discovery, lookin for groups in data, find outliers, identify common dimensions, patterns, and trends.) - **Prediction models** (Regression; Classification and Clustering;) and Evaluations (Recommender systems, collaborative filtering, association rules, optimization methods based on linguistic heuristics, as well as a myriad of methods for regression, classification, and clustering fall under the rubric of machine learning). --- background-image: url(../img/emo/boredom-small.png) --- ## 前處理回顧  [助教部落文](https://yongfu.name/2018/07/28/quanteda-tutorial.html) --- ## 從前處理到 EDA [大家一起走一次 quanteda tutorial](https://tutorials.quanteda.io)  --- ## Textual EDA: 文本資料怎麼作圖? - 我們想要利用視覺化技術探勘文本中的訊息、趨勢、模式變化。例如 - 批踢踢語料中呈現的鄉民行為與社會網路 - 不同作者的書寫風格 - (選前選後的)政治觀點、主張、價值比較 - 基本的可能 - 文字雲 (word cloud) 與比較 - 關聯圖 (correlation plot) 與字/詞組樹 (word/phrase tree) - 社會網路 (social network) --- ## 文字雲 Word Cloud - A word cloud is simply a graphical representation in which the size of the font used for the word corresponds to its frequency relative to others. Bigger the size of the word, higher is its frequency. - `wordcloud2`, `RColorBrewer` 都可以。 --- ## 文字雲也可以比較 - To construct a **comparison cloud**, we require the data to be in the form of a term matrix. The `tm` package provides us with the `TermDocumentMatrix()` function that constructs a term document matrix: ```r #colnames(data) <- c("bush","obama") #comparison.cloud(data,max.words = 250, title.size = 2,colors = brewer.pal(3,"Set1")) ``` <img src="images/cloud.jpg" alt="Drawing" style="width: 400px;"/> --- ## 詞組樹 wordTree `googleVis: R Interface to Google Charts` - A phrase tree or a word tree provides useful insight into text as it provides a context and not just the frequency of words. <https://www.jasondavies.com/wordtree/> ```r library(googleVis) wt1 <- gvisWordTree(Cats, textvar = "Phrase") plot(wt1) ``` <!-- <img src="images/tree.jpg" alt="Drawing" style="width: 850px;"/> --> --- ## motion chart 對於關注資料變遷有幫助 <iframe width="550" height="450" src="https://www.youtube.com/embed/6LUjgHPhxRw" frameborder="0" allowfullscreen></iframe> --- ## 語言大數據發揮創意的話也可以看到很多東西 [Google book ngram](https://books.google.com/ngrams/) <img src="images/gngram.png" alt="Drawing" style="width: 700px;"/> --- ## 用 R 玩看看 - [`ngramr`](https://github.com/seancarmody/ngramr): R package to query the Google Ngram Viewer ```r library(ngramr) # install locally! library(ggplot2) ggram(c("monarchy", "democracy"), year_start = 1500, year_end = 2000, corpus = "eng_gb_2012", ignore_case = TRUE, geom = "area", geom_options = list(position = "stack")) + labs(y = NULL) ``` <!-- --> --- ## 這個圖怎麼解釋? <img src="index_files/figure-html/unnamed-chunk-4-1.png" style="display: block; margin: auto;" /> --- ## 從語言學角度的提醒 .large[ - 停用詞 (`stop words`) 慎用 - 語料庫 (`corpus`) 的概念與應用沒那麼簡單 ] <!-- --- --> <!-- ## 愛人與太太的消長 --> <!-- ```{r} --> <!-- # rownames(corpuses) --> <!-- ggram(c("愛人", "太太"), year_start = 1500, year_end = 2000, --> <!-- corpus = "chi_sim_2012", ignore_case = TRUE, --> <!-- geom = "area", --> <!-- geom_options = list(position = "stack"))+labs(y = NULL) --> <!-- ``` --> --- ## 語言資源 (Language Resources) - 語料庫 corpus - 詞庫 lexicon / lexical (knowledge) resources - 知識本體 ontologies --- ## 語料庫:概念 - 語料庫 (Corpus) 是自然語言處理與文本解析的基礎建設。 a large collection of texts used for various purposes in Natural Language Processing (NLP). - 標記 (annotation) 是核心。It's linguistic in nature. > Good annotations support good applications --- ## 語料庫:工具 一般主要提供以下功能: - Corpus building and indexing - Concordance - Frequency list - (Grammatical) Collocations (and colligations) - Keywords - Thesaurus - ngram - Visualization --- ## 語料庫:工具 [Voyant](http://voyant-tools.org/?corpus=7fda0cccc3e3da40ce4f6b5c38347689) <img style = 'border: 1px solid;' width = 90%; src='./images/voyant.png'></img> [Word Sketch Engine](https://www.sketchengine.eu)